
Q2 2016 saw Backblaze: introduce 8TB drives into our drive mix, kickoff a pod-to-vault migration of over 6.5 Petabytes of data, cross over 250 Petabytes of data stored, and deploy another 7,290 drives into the data center for a total of 68,813 spinning hard drives under management. With all the ins-and-outs let’s take a look at how our hard drives fared in Q2 2016.
Backblaze hard drive reliability for Q2 2016
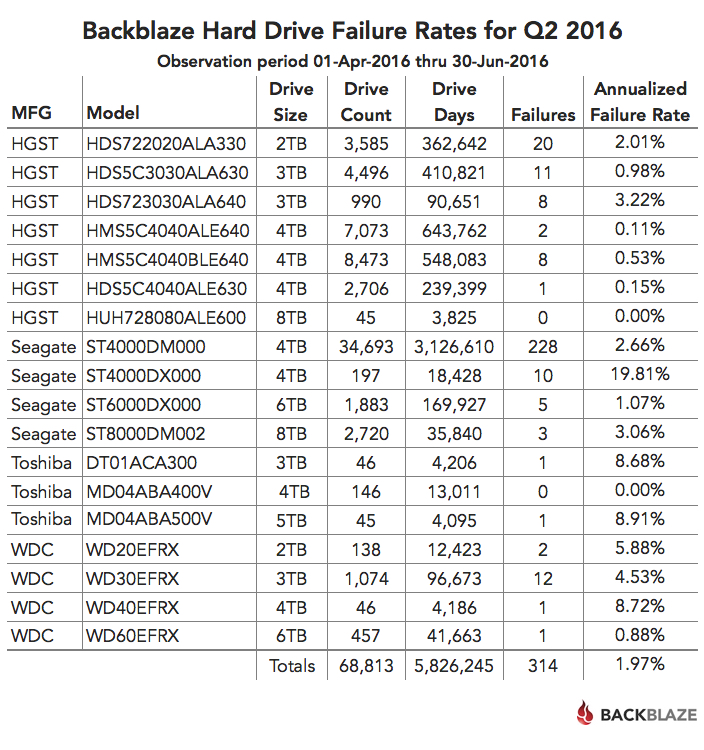
Below is the hard drive failure data for Q2 2016. This chart is just for the period of Q2 2016. The hard drive models listed below are data drives (not boot drives), and we only list models which have 45 or more drives of that model deployed.
A couple of observations on the chart:
Later in this post we’ll review the cumulative statistics for all of our drives over time, but first let’s take a look at the new drives on the block...
- The models that have an annualized failure rate of 0.00% had zero hard drive failures in Q2 2016.
- The annualized failure rate is computed as follows: ((Failures)/(Drive Days/365)) * 100. Therefore consider the number of “Failures” and “Drive Days” before reaching any conclusions about the failure rate.
Read more: Hard Drive Failure Rates: The Results from 68,813 Hard Drives