
You are using an out of date browser. It may not display this or other websites correctly.
You should upgrade or use an alternative browser.
You should upgrade or use an alternative browser.
Solved Windows 8 Memory Management/Leaks
- Thread starter w0rtez
- Start date


- Messages
- 3,658
- Location
- Westland, MI
^ That screenshot is not helping. Unless you have a zillion 1MB apps running, I only see about 1GB or less of RAM being consumed there.
My Computer
System One
-
- OS
- Windows 7
- System Manufacturer/Model
- Self-Built in July 2009
- CPU
- Intel Q9550 2.83Ghz OC'd to 3.40Ghz
- Motherboard
- Gigabyte GA-EP45-UD3R rev. 1.1, F12 BIOS
- Memory
- 8GB G.Skill PI DDR2-800, 4-4-4-12 timings
- Graphics Card(s)
- EVGA 1280MB Nvidia GeForce GTX570
- Sound Card
- Realtek ALC899A 8 channel onboard audio
- Monitor(s) Displays
- 23" Acer x233H
- Screen Resolution
- 1920x1080
- Hard Drives
- Intel X25-M 80GB Gen 2 SSD
Western Digital 1TB Caviar Black, 32MB cache. WD1001FALS
- PSU
- Corsair 620HX modular
- Case
- Antec P182
- Cooling
- stock
- Keyboard
- ABS M1 Mechanical
- Mouse
- Logitech G9 Laser Mouse
- Internet Speed
- 15/2 cable modem
- Other Info
- Windows and Linux enthusiast. Logitech G35 Headset.

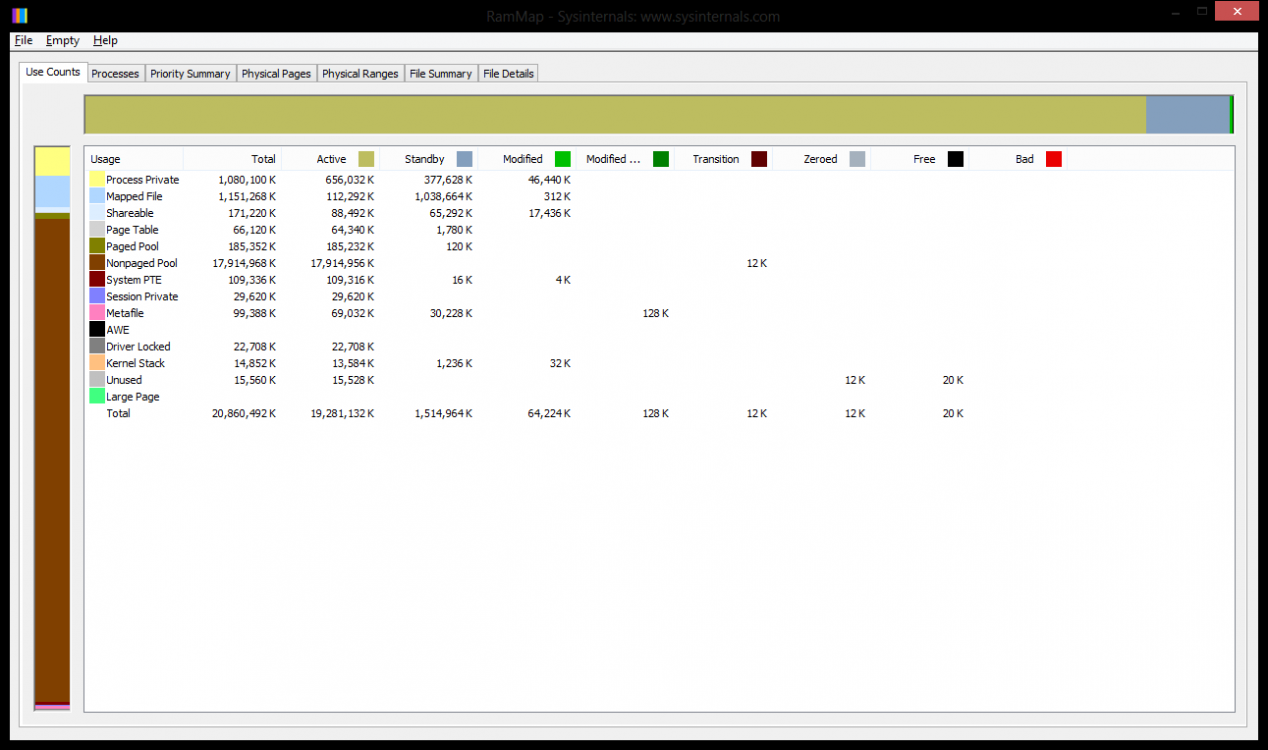
Get a RAMMap output, or we can't provide anything further than we already have. I'm sorry I'm being so curt, but that's really about all we can do right now. We're past the screenshot stage, we need actual data now ") .
.
.My Computer
System One
-
- OS
- Windows 8.1 x64
- Computer type
- PC/Desktop
- System Manufacturer/Model
- Custom
- CPU
- Intel Core i7 4790K @ 4.5GHz
- Motherboard
- Asus Maximus Hero VII
- Memory
- 32GB DDR3
- Graphics Card(s)
- Nvidia GeForce GTX970
- Sound Card
- Realtek HD Audio
- Hard Drives
- 1x Samsung 250GB SSD
4x WD RE 2TB (RAIDZ)
- PSU
- Corsair AX760i
- Case
- Fractal Design Define R4
- Cooling
- Noctua NH-D15
Get a RAMMap output, or we can't provide anything further than we already have. I'm sorry I'm being so curt, but that's really about all we can do right now. We're past the screenshot stage, we need actual data now
If you need anything else, let me know.
Thanks for yout help
Attachments
My Computer
System One
-
- OS
- Windows 8
- Computer type
- Laptop


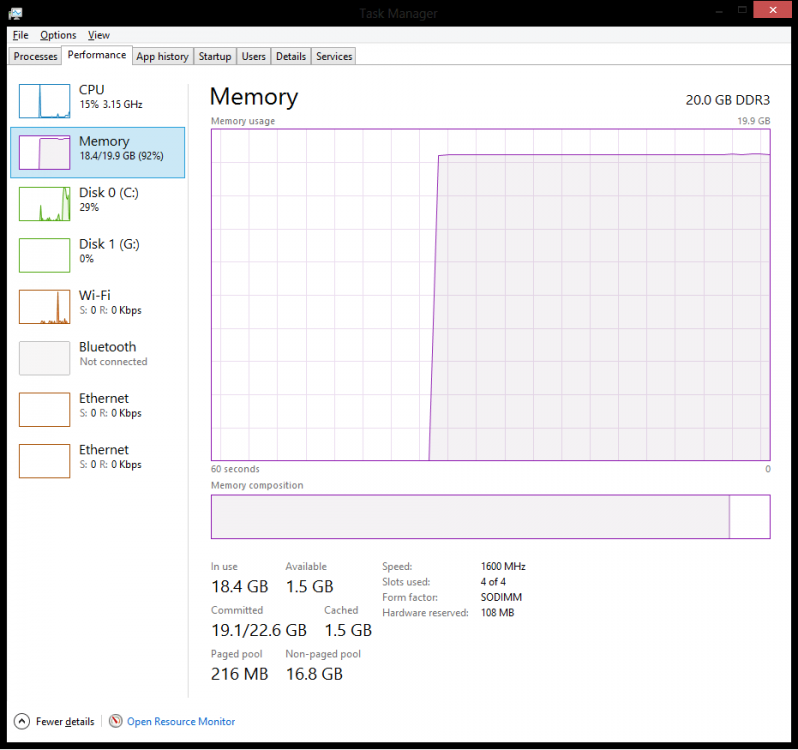
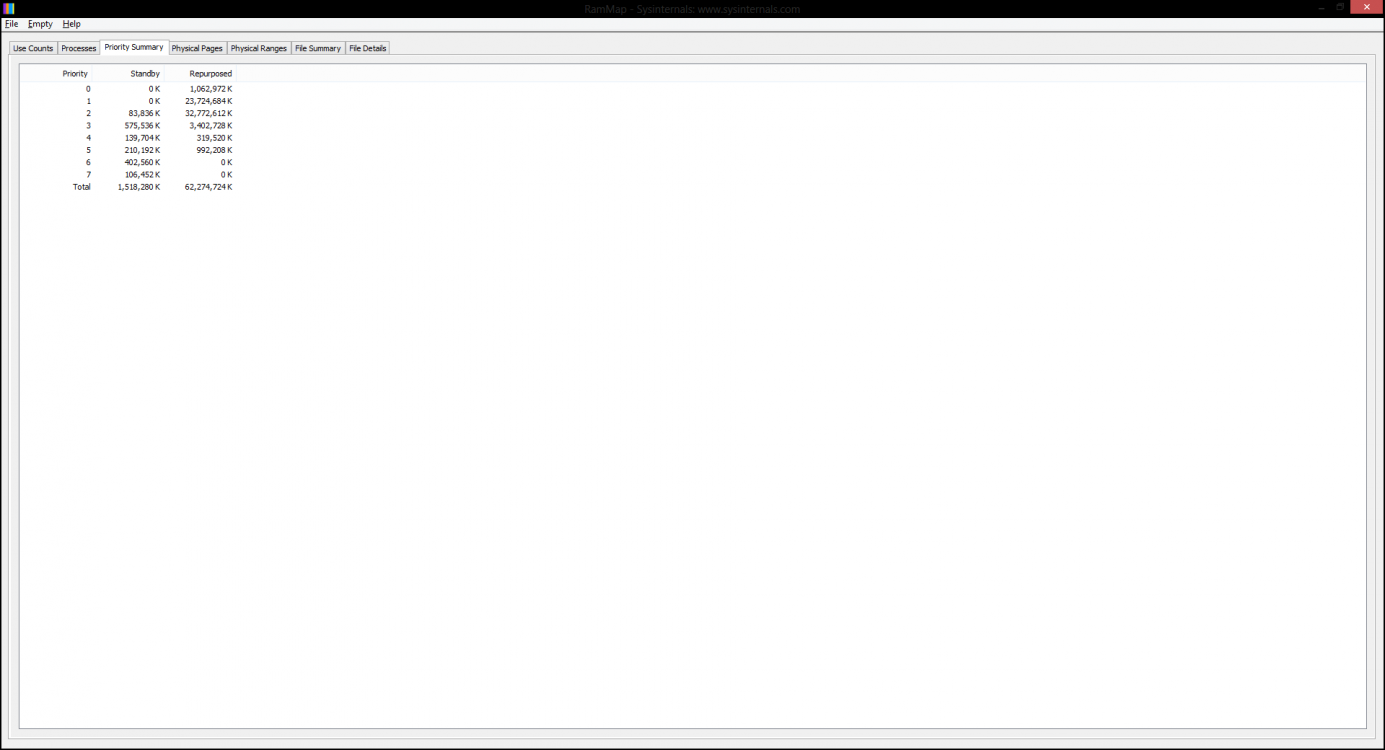
The problem is the Non-paged pool. In Task Manager it shows 16.8 GB, about 100 times what would be a reasonable value. Also shown in the original post.
I suspect this is caused by a faulty device driver or malware. cluberti will know more.
I suspect this is caused by a faulty device driver or malware. cluberti will know more.
My Computer
System One
-
- OS
- Windows 7
- Computer type
- PC/Desktop

- Messages
- 4,370
- Location
- Belo Horizonte, MG, Brazil
Wow... 16.8 GB... Normal values for non-pagable memory are about 2-4% of the total memory.
:shock:
:shock:
My Computer
System One
-
- OS
- Windows 10.0.10122
- Computer type
- PC/Desktop
- System Manufacturer/Model
- My Build - Vorttex Ultimate
- CPU
- Core i7 @ 4500 MHz
- Motherboard
- ASUS Z87-Plus
- Memory
- 32GB DDR3 @ 1822 MHz (OC)
- Graphics Card(s)
- Radeon R9 280X 3GB @ 1180 / 6800 MHz
- Sound Card
- 7.1 HDA
- Monitor(s) Displays
- LCD LG 22" + CRT LG 17"
- Screen Resolution
- 1760 x 1320 / 1280 x 960
- Hard Drives
- 1 x 240 GB SSD (System)
3 x 500 GB HDD (Data/Media)
1 x 2000 GB e-HDD (Backup)
- PSU
- ThermalTake 1000W PSU
- Case
- Corsair Carbide R300
- Cooling
- Corsair H60 (Push-Pull)
- Keyboard
- Microsoft Wireless Keyboard
- Mouse
- Microsoft Wireless Mouse
- Internet Speed
- 60 Mbps (Down) 5 Mbps (Up)
- Browser
- IE, FF, Chrome
- Antivirus
- AVG Internet Security 2015
- Other Info
- Some wired stuff
- Messages
- 4,370
- Location
- Belo Horizonte, MG, Brazil
My Computer
System One
-
- OS
- Windows 10.0.10122
- Computer type
- PC/Desktop
- System Manufacturer/Model
- My Build - Vorttex Ultimate
- CPU
- Core i7 @ 4500 MHz
- Motherboard
- ASUS Z87-Plus
- Memory
- 32GB DDR3 @ 1822 MHz (OC)
- Graphics Card(s)
- Radeon R9 280X 3GB @ 1180 / 6800 MHz
- Sound Card
- 7.1 HDA
- Monitor(s) Displays
- LCD LG 22" + CRT LG 17"
- Screen Resolution
- 1760 x 1320 / 1280 x 960
- Hard Drives
- 1 x 240 GB SSD (System)
3 x 500 GB HDD (Data/Media)
1 x 2000 GB e-HDD (Backup)
- PSU
- ThermalTake 1000W PSU
- Case
- Corsair Carbide R300
- Cooling
- Corsair H60 (Push-Pull)
- Keyboard
- Microsoft Wireless Keyboard
- Mouse
- Microsoft Wireless Mouse
- Internet Speed
- 60 Mbps (Down) 5 Mbps (Up)
- Browser
- IE, FF, Chrome
- Antivirus
- AVG Internet Security 2015
- Other Info
- Some wired stuff
So how did everything work out for you w0rtez, did you solve the issue or are you still having problems?
I'm having the same problem and I've tried to disable a network-driver that I don't remember the name of atm.
I've also tried updating softwares everytime, but since it can take from a couple of hours to several days til the issue turns up again it's hard to keep on why the issue appears.
It occurs for me when I am multiplayer games, so that's why I thought It might be that bugged network-driver.
My Computer
System One
-
- OS
- 8
Hello,
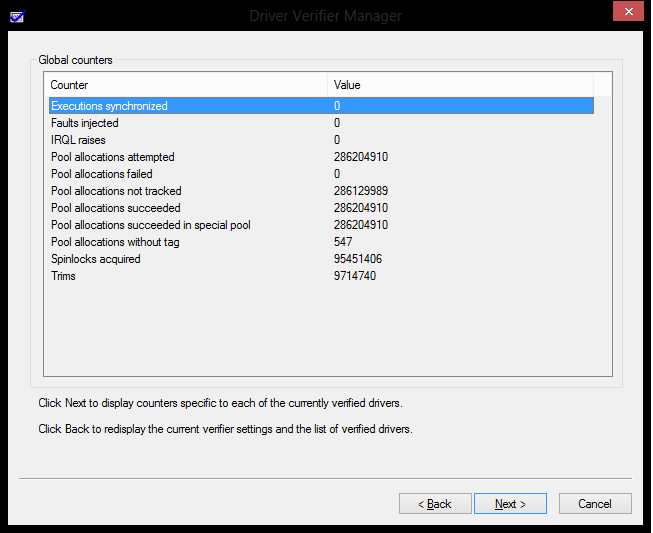
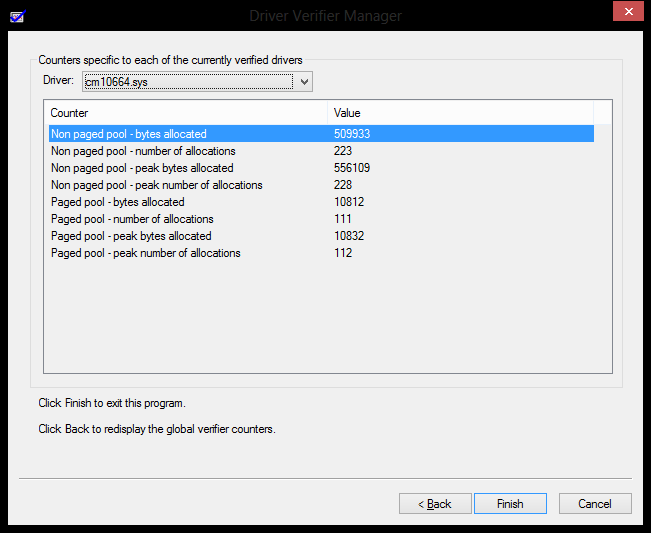
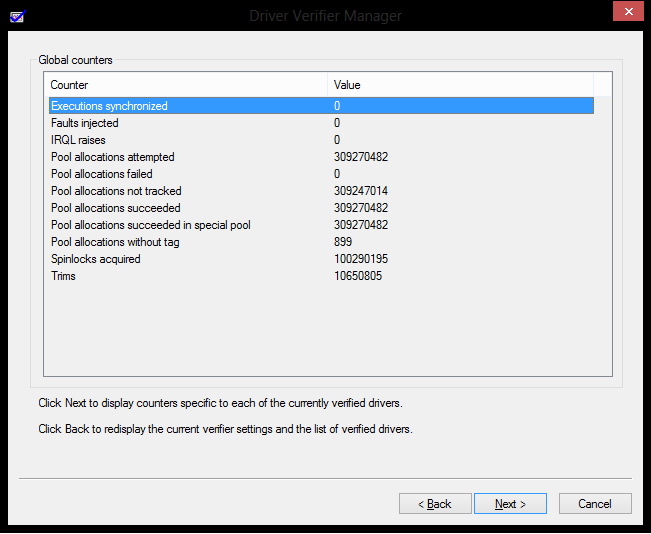
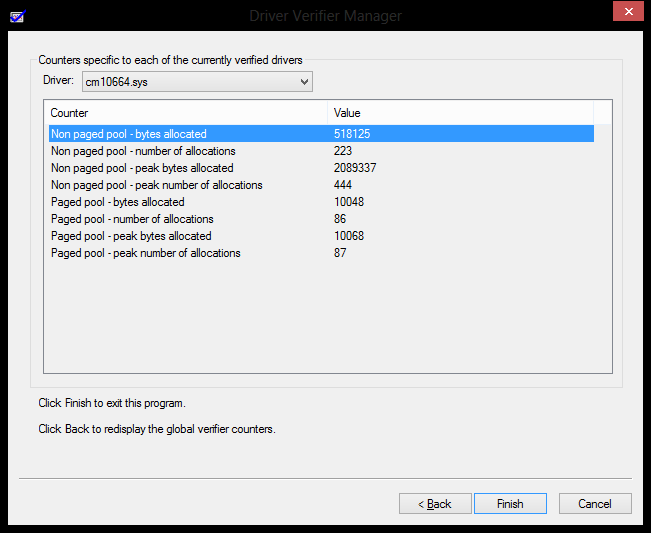
Now that you mention it, i have been leaving lately utorrent on always 24/7 and my computer becomes unusable when it hit like 3 straight day, so it might be my problem too, i dont know... Here's the screenshot that i didnt post yet of the drivers i was checking out but i dont know if it were the ones causing my problem...
Now that you mention it, i have been leaving lately utorrent on always 24/7 and my computer becomes unusable when it hit like 3 straight day, so it might be my problem too, i dont know... Here's the screenshot that i didnt post yet of the drivers i was checking out but i dont know if it were the ones causing my problem...
Attachments
My Computer
System One
-
- OS
- Windows 8
- Computer type
- Laptop
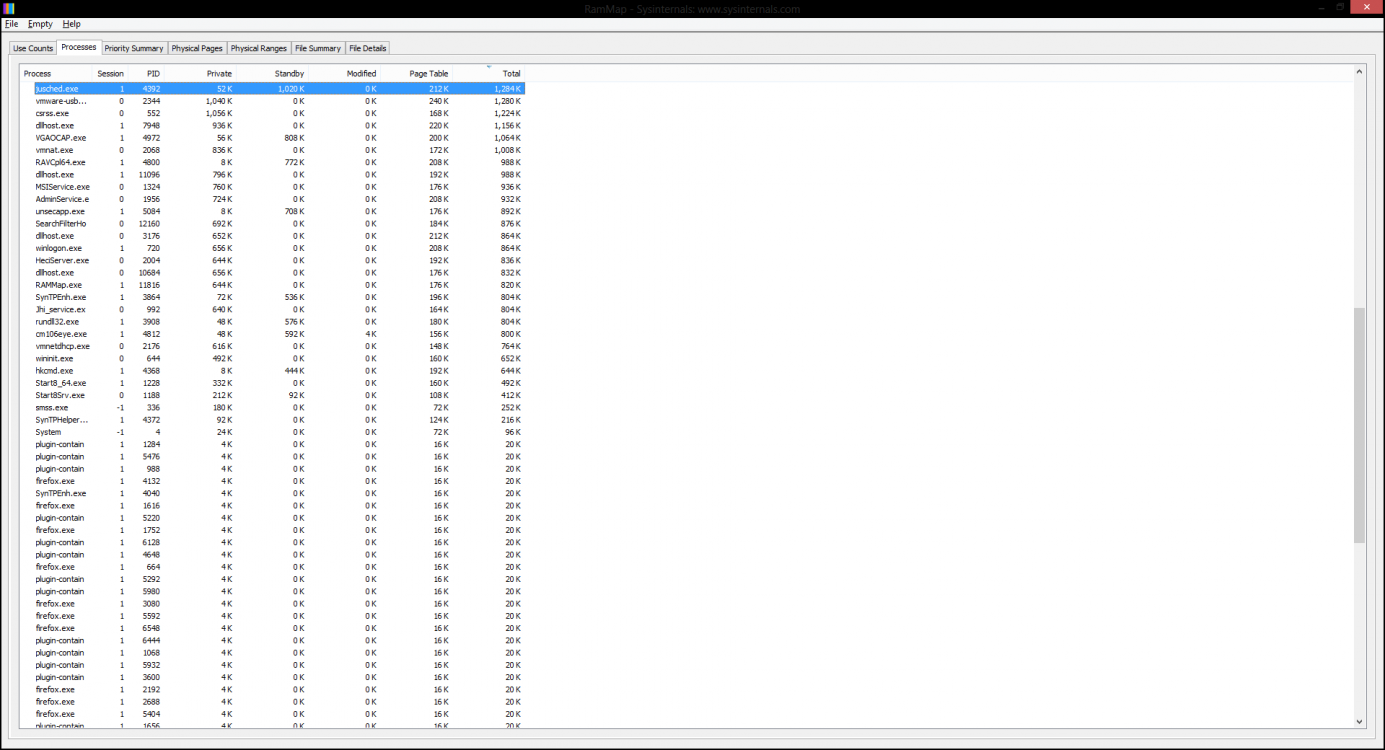
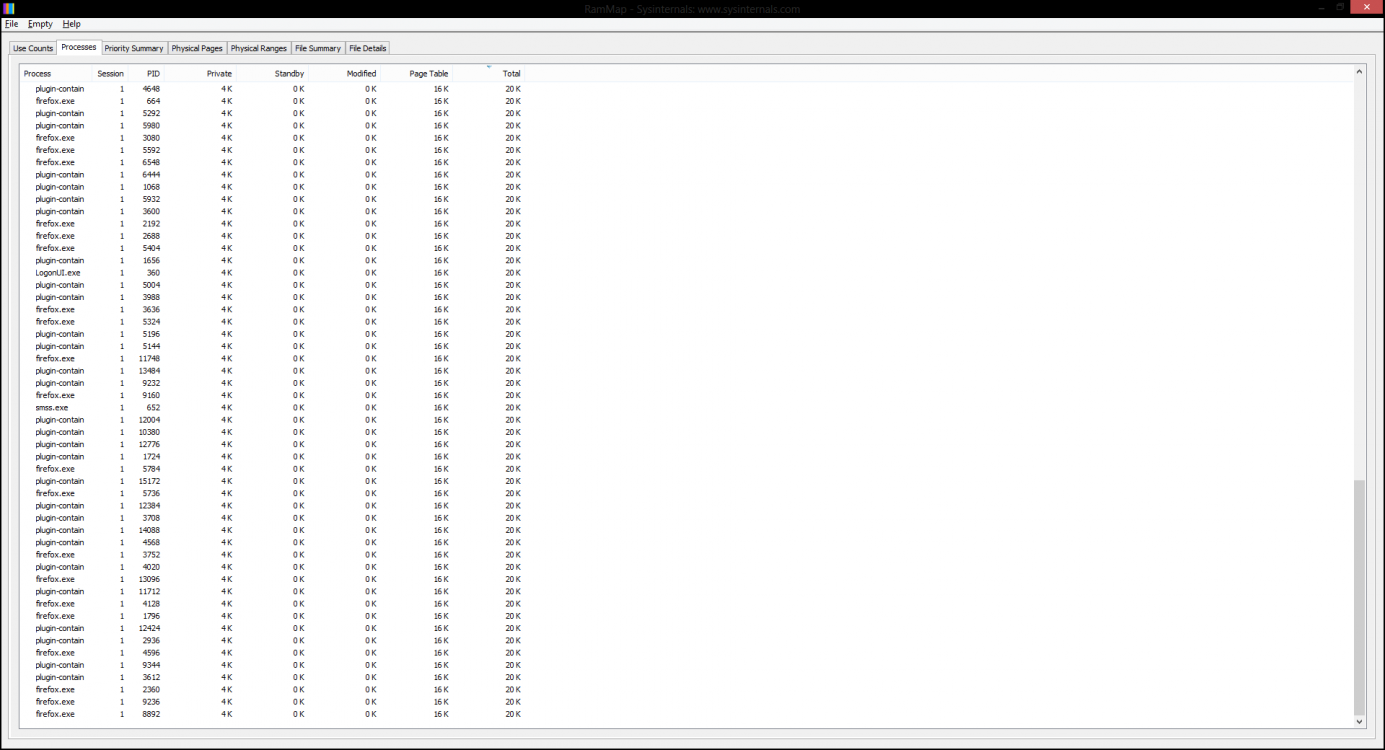
Get a RAMMap output, or we can't provide anything further than we already have. I'm sorry I'm being so curt, but that's really about all we can do right now. We're past the screenshot stage, we need actual data now
Here you go... i'm still getting peaks... Please help...
Zippyshare.com - Mem_File.rar
My Computer
System One
-
- OS
- Windows 8
- Computer type
- Laptop
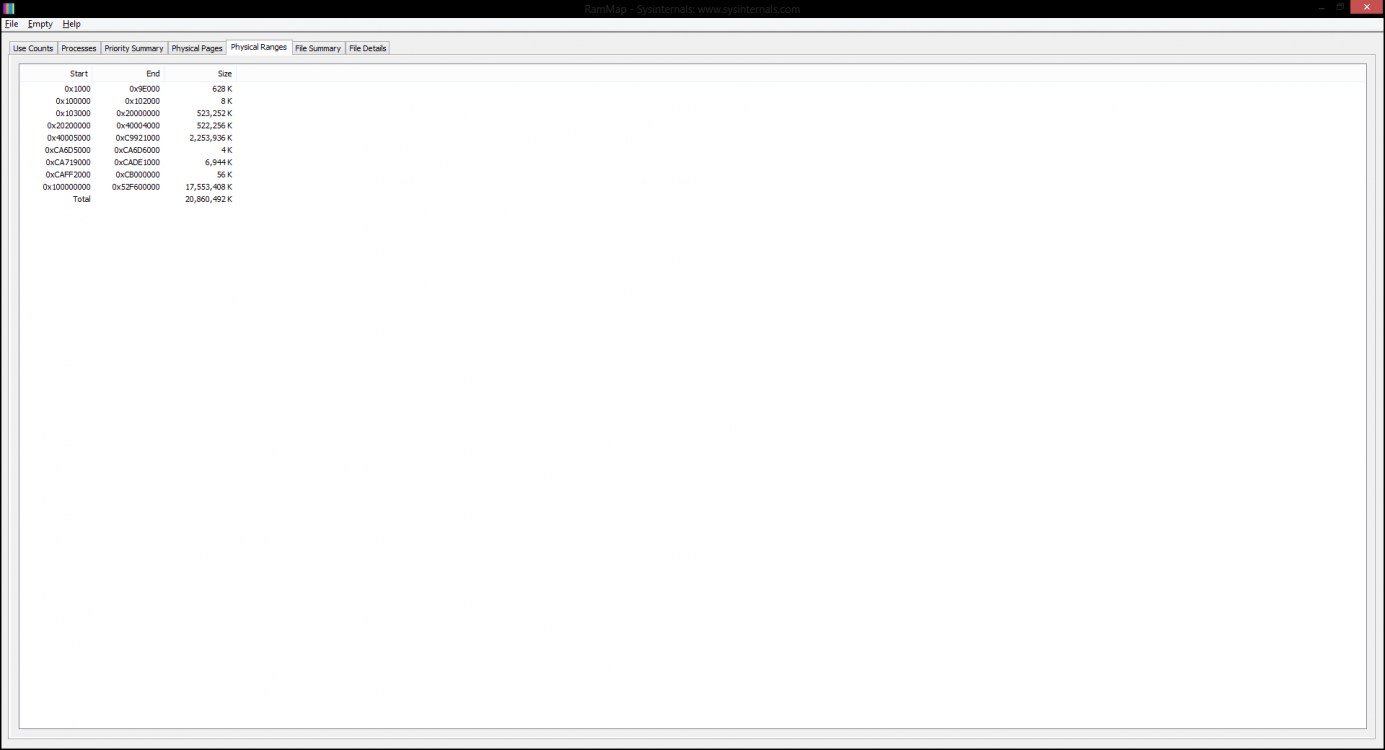
OK, so this looks to be almost all used in Nonpaged pool (a region of kernel memory used mostly for driver use). Now that we know it is almost all nonpaged pool, we can figure out what's going on. However, I'm going to need for you to get a rather detailed trace of your machine to figure this out using the Windows Performance Toolkit. I'll update a tutorial on this in the future, but here are the instructions on how to gather a trace tracking pool allocations.
First, you need to run the web installer for the Assessment and Deployment Kit for Windows 8.1 (even if you're on Windows 7 or Windows 8, this is the version you will want to use):

Once you click the "Download" button and run the installer, you will see a download box to specify a location - just click the "Next" button:

The only option you need to select is the "Windows Performance Toolkit", and then click the "Install" button:

It will download and install the WPT component at this point:

Once installed, you should have some new icons in your modern start screen (if you're using 8.1, you'll have to go down to the all applications list, or just type "wpr" to find it). In this screenshot, it's the icon on the bottom-left of this group:

Once you've got the Windows Performance Recorder open, uncheck the "First level triage" box, and check the "Pool Usage" box, and then click the "Start" button to start tracing:

You should see the trace window change slightly to notify you that it's started tracing the system:

Let the reproduction of the memory consumption issue run for at least a few hours, up to a day or so if necessary - however, if you notice any large spikes in memory usage during this time, you can save the trace earlier (this is going to generate a LARGE file, so the less time traced and still capture the data, the better).
Once you're comfortable memory usage has increased steadily to the point you'd consider it an obvious issue, please click the "Save" button, where you'll then be presented the ability to save the trace file:

Make sure you save it somewhere where you have LOTS of disk space available (preferably a few GB), and then click the "Save" button - it will start writing the file out to the location you specified here:

Once the file has saved successfully, click the "OK" button:

I will need you to zip up the resulting .ETL file that was saved, and upload it to a file hoster (or PM me and I'll give you an FTP location to upload) so I can download and analyze the behavior:

First, you need to run the web installer for the Assessment and Deployment Kit for Windows 8.1 (even if you're on Windows 7 or Windows 8, this is the version you will want to use):
Once you click the "Download" button and run the installer, you will see a download box to specify a location - just click the "Next" button:
The only option you need to select is the "Windows Performance Toolkit", and then click the "Install" button:
It will download and install the WPT component at this point:
Once installed, you should have some new icons in your modern start screen (if you're using 8.1, you'll have to go down to the all applications list, or just type "wpr" to find it). In this screenshot, it's the icon on the bottom-left of this group:
Once you've got the Windows Performance Recorder open, uncheck the "First level triage" box, and check the "Pool Usage" box, and then click the "Start" button to start tracing:
You should see the trace window change slightly to notify you that it's started tracing the system:
Let the reproduction of the memory consumption issue run for at least a few hours, up to a day or so if necessary - however, if you notice any large spikes in memory usage during this time, you can save the trace earlier (this is going to generate a LARGE file, so the less time traced and still capture the data, the better).
Once you're comfortable memory usage has increased steadily to the point you'd consider it an obvious issue, please click the "Save" button, where you'll then be presented the ability to save the trace file:
Make sure you save it somewhere where you have LOTS of disk space available (preferably a few GB), and then click the "Save" button - it will start writing the file out to the location you specified here:
Once the file has saved successfully, click the "OK" button:
I will need you to zip up the resulting .ETL file that was saved, and upload it to a file hoster (or PM me and I'll give you an FTP location to upload) so I can download and analyze the behavior:
My Computer
System One
-
- OS
- Windows 8.1 x64
- Computer type
- PC/Desktop
- System Manufacturer/Model
- Custom
- CPU
- Intel Core i7 4790K @ 4.5GHz
- Motherboard
- Asus Maximus Hero VII
- Memory
- 32GB DDR3
- Graphics Card(s)
- Nvidia GeForce GTX970
- Sound Card
- Realtek HD Audio
- Hard Drives
- 1x Samsung 250GB SSD
4x WD RE 2TB (RAIDZ)
- PSU
- Corsair AX760i
- Case
- Fractal Design Define R4
- Cooling
- Noctua NH-D15
OK, so this looks to be almost all used in Nonpaged pool (a region of kernel memory used mostly for driver use). Now that we know it is almost all nonpaged pool, we can figure out what's going on. However, I'm going to need for you to get a rather detailed trace of your machine to figure this out using the Windows Performance Toolkit. I'll update a tutorial on this in the future, but here are the instructions on how to gather a trace tracking pool allocations.
First, you need to run the web installer for the Assessment and Deployment Kit for Windows 8.1 (even if you're on Windows 7 or Windows 8, this is the version you will want to use):
View attachment 28926
Once you click the "Download" button and run the installer, you will see a download box to specify a location - just click the "Next" button:
View attachment 28927
The only option you need to select is the "Windows Performance Toolkit", and then click the "Install" button:
View attachment 28928
It will download and install the WPT component at this point:
View attachment 28929
Once installed, you should have some new icons in your modern start screen (if you're using 8.1, you'll have to go down to the all applications list, or just type "wpr" to find it). In this screenshot, it's the icon on the bottom-left of this group:
View attachment 28930
Once you've got the Windows Performance Recorder open, uncheck the "First level triage" box, and check the "Pool Usage" box, and then click the "Start" button to start tracing:
View attachment 28931
You should see the trace window change slightly to notify you that it's started tracing the system:
View attachment 28932
Let the reproduction of the memory consumption issue run for at least a few hours, up to a day or so if necessary - however, if you notice any large spikes in memory usage during this time, you can save the trace earlier (this is going to generate a LARGE file, so the less time traced and still capture the data, the better).
Once you're comfortable memory usage has increased steadily to the point you'd consider it an obvious issue, please click the "Save" button, where you'll then be presented the ability to save the trace file:
View attachment 28933
Make sure you save it somewhere where you have LOTS of disk space available (preferably a few GB), and then click the "Save" button - it will start writing the file out to the location you specified here:
View attachment 28934
Once the file has saved successfully, click the "OK" button:
View attachment 28935
I will need you to zip up the resulting .ETL file that was saved, and upload it to a file hoster (or PM me and I'll give you an FTP location to upload) so I can download and analyze the behavior:
View attachment 28936
Ok. I did a few files, hope we can detect our problems there, waiting for further instructions
My Computer
System One
-
- OS
- Windows 8
- Computer type
- Laptop
PM sent.
My Computer
System One
-
- OS
- Windows 8.1 x64
- Computer type
- PC/Desktop
- System Manufacturer/Model
- Custom
- CPU
- Intel Core i7 4790K @ 4.5GHz
- Motherboard
- Asus Maximus Hero VII
- Memory
- 32GB DDR3
- Graphics Card(s)
- Nvidia GeForce GTX970
- Sound Card
- Realtek HD Audio
- Hard Drives
- 1x Samsung 250GB SSD
4x WD RE 2TB (RAIDZ)
- PSU
- Corsair AX760i
- Case
- Fractal Design Define R4
- Cooling
- Noctua NH-D15
It's hard to say from the data gathered, as the issue has pretty much 100% occured in each trace, but the two tags most in use are Wfpn and NBNB, which translate back to netio.sys (network I/O subsystem) and ndu.sys (network data usage monitor). Since these tags in and of themselves aren't called by the OS to this level, something running on the machine is likely hammering the network stack. Also, since I don't see any indication of which process, it's likely going through typical OS binaries (like wininet.dll or winhttp.sys) to make it's network calls. I can see you have quite a bit of networking software on the box - mDNS, probably from iTunes or other Apple software, No-IP, a torrent client, and something called the Qualcomm Atheros Killer Network Monitor (remember one of the tags was the network monitoring one?). That last one is a major suspect, as is the torrent client. I would recommend disabling ALL of these applications, especially the Qualcomm software and the torrent client, and reboot and monitor. If the problem persists, get more data - otherwise, re-enable things one at a time until the problem comes back.
Given the tags and binaries called out by the trace, I'd wager it's either the Qualcomm software directly, or it's behavior with the torrent client running, that's causing this. However, anyone can guess, and I prefer data. Let's see what happens with the recommendations I made.
Given the tags and binaries called out by the trace, I'd wager it's either the Qualcomm software directly, or it's behavior with the torrent client running, that's causing this. However, anyone can guess, and I prefer data. Let's see what happens with the recommendations I made.
My Computer
System One
-
- OS
- Windows 8.1 x64
- Computer type
- PC/Desktop
- System Manufacturer/Model
- Custom
- CPU
- Intel Core i7 4790K @ 4.5GHz
- Motherboard
- Asus Maximus Hero VII
- Memory
- 32GB DDR3
- Graphics Card(s)
- Nvidia GeForce GTX970
- Sound Card
- Realtek HD Audio
- Hard Drives
- 1x Samsung 250GB SSD
4x WD RE 2TB (RAIDZ)
- PSU
- Corsair AX760i
- Case
- Fractal Design Define R4
- Cooling
- Noctua NH-D15
It's hard to say from the data gathered, as the issue has pretty much 100% occured in each trace, but the two tags most in use are Wfpn and NBNB, which translate back to netio.sys (network I/O subsystem) and ndu.sys (network data usage monitor). Since these tags in and of themselves aren't called by the OS to this level, something running on the machine is likely hammering the network stack. Also, since I don't see any indication of which process, it's likely going through typical OS binaries (like wininet.dll or winhttp.sys) to make it's network calls. I can see you have quite a bit of networking software on the box - mDNS, probably from iTunes or other Apple software, No-IP, a torrent client, and something called the Qualcomm Atheros Killer Network Monitor (remember one of the tags was the network monitoring one?). That last one is a major suspect, as is the torrent client. I would recommend disabling ALL of these applications, especially the Qualcomm software and the torrent client, and reboot and monitor. If the problem persists, get more data - otherwise, re-enable things one at a time until the problem comes back.
Given the tags and binaries called out by the trace, I'd wager it's either the Qualcomm software directly, or it's behavior with the torrent client running, that's causing this. However, anyone can guess, and I prefer data. Let's see what happens with the recommendations I made.
I have uploaded another file... Please check and let me know.
Thanks.
My Computer
System One
-
- OS
- Windows 8
- Computer type
- Laptop
Yes, it's still the same tags. Did you make the changes recommended? (hint - rhetorical question, I can see from the traces you did not). I still need for you to actually attempt to do what I asked in my previous post. If the problem persists after making the changes I requested, we will need to discuss trace strategy - by the time the trace is stopped, almost all of the allocs against that tag have already transpired. We would need to catch them happening to have a smoking gun, so to speak.
My Computer
System One
-
- OS
- Windows 8.1 x64
- Computer type
- PC/Desktop
- System Manufacturer/Model
- Custom
- CPU
- Intel Core i7 4790K @ 4.5GHz
- Motherboard
- Asus Maximus Hero VII
- Memory
- 32GB DDR3
- Graphics Card(s)
- Nvidia GeForce GTX970
- Sound Card
- Realtek HD Audio
- Hard Drives
- 1x Samsung 250GB SSD
4x WD RE 2TB (RAIDZ)
- PSU
- Corsair AX760i
- Case
- Fractal Design Define R4
- Cooling
- Noctua NH-D15
I heard around that the problem relies on the Bigfoot Killer with some sort of bug that drivers still doesn't solve it, and there was a solution of disabling Windows 8 Network Monitoring... How to do it and what do i lose by doing it.
My Computer
System One
-
- OS
- Windows 8
- Computer type
- Laptop

Hi Guy's, I dont want to jeopardize your discussion here, but just to inform you I'm following this post with interest as I have recently got a very similar problem on my new installation W8.1 64 bits. It happens only when I'm playing a few hours with BF4, never when I work for twice this length with typical office type of apps
Symptom is simple, when the memory jam occurs, my game start to lag then I cannot play anymore even to a point I cannot kill it and when I'm looking at tasks and space meory occupation, nothing special to the size of all tasks but memory shows 99% occupancy like if if was reserved or lost zombie memory
I though initially it was a memory problem as I have just installed a stack of 32 gb at the same time of install 8.1, but why would it be HW if all the day it is working fine? So I'm now more looking same direction as you do
hoping you come to a conclusion
I found also this post Windows 8 Extremely High Memory Usage ~8GB!!!!! [Solved] - disk usage - Windows 8
where a"lot" of people are having similar behavior than mine...good thing is...we are not alone, bad thing is it's there since a year...
My Computer
System One
-
- OS
- windows 8.1
- Computer type
- PC/Desktop
- System Manufacturer/Model
- Home made
- CPU
- /860I
- Motherboard
- Gigabyte P55a uda6
- Memory
- GSKILL-1866-C9Q-32
- Graphics Card(s)
- ATI Radeon 5870
- Browser
- Firefox, Chrome, IE
- Antivirus
- Kaspersky