How to Open and Use Performance Dashboard in Internet Explorer 11
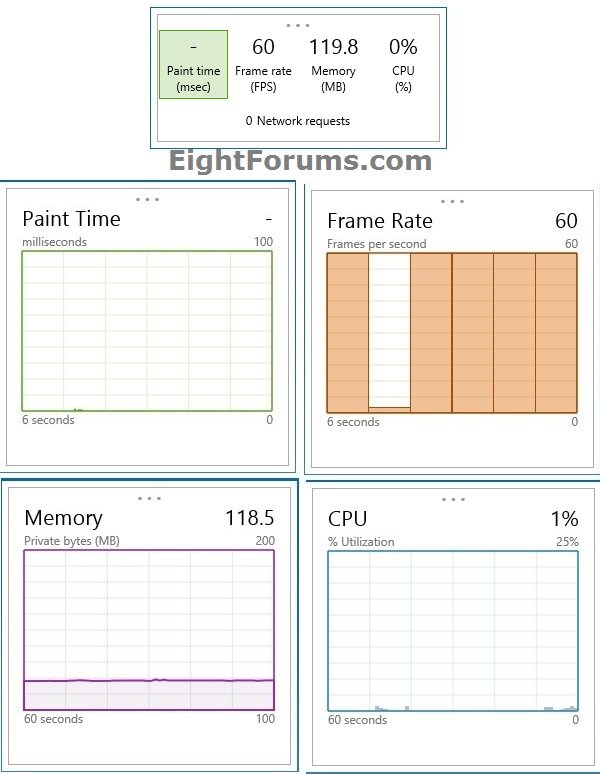
The Performance dashboard in Internet Explorer 11 (IE11) is a tool that quickly gives you the time it takes a webpage to render changes that were made to the DOM (Paint Time), how many frames per second it's rendering (Frame Rate), how much memory it's using (Memory), and how much demand it's putting on your processor (CPU).
The dashboard is a great starting point for identifying the actions that cause slowness in your website. Then use the UI Responsiveness profiler to get finer details of the problems.
For more information, see: Improving UI responsiveness (Windows)
This tutorial will show you how to open and use the Performance dashboard in the modern and desktop Internet Explorer 11 (IE11) in Windows 7, Windows 8.1, and Windows RT 8.1.
If you click/tap on a measurement in the dashboard, you get a running graph that shows ups and downs over time. When you're done, click/tap on the graph to return to the dashboard.
If you click/tap and hold on the 3 dots at the top of the dashboard or graph, you will be able to drag and drop to move it anywhere you like within the opened IE11 tab.
If you click/tap and hold on the 3 dots
EXAMPLE: Performance dashboard in Internet Explorer 11 (IE11)
OPTION ONE
To Open Performance Dashboard in Modern IE11
NOTE: This option is only available in Windows 8.1 and Windows RT 8.1.
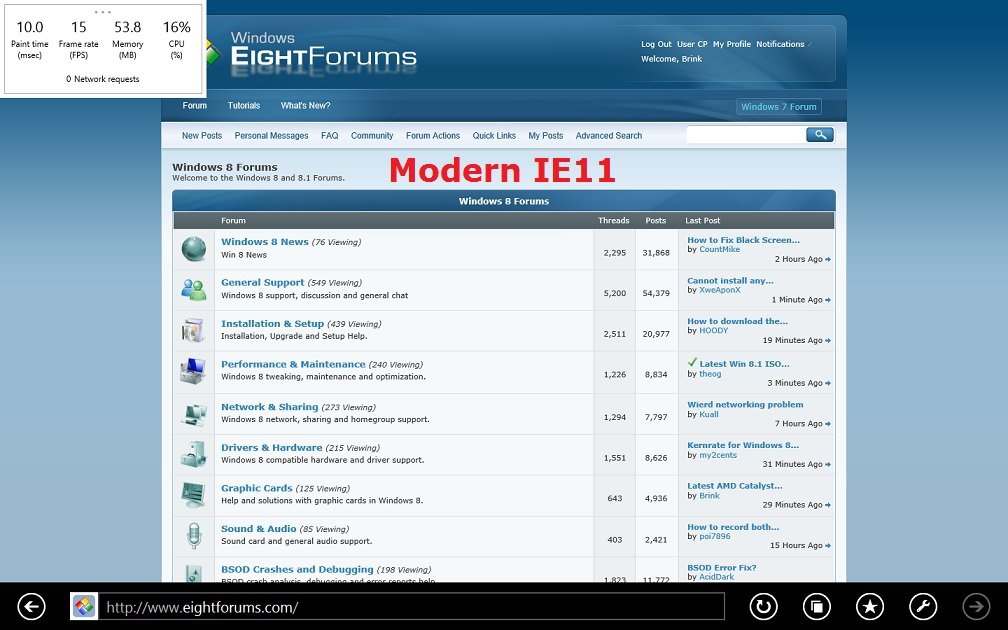
1. From your Start screen, open the modern IE11, and open a website in a tab that you wish to check the performance of.
2. Press the CTRL+Shift+U keys to toggle to open and close the Performance dashboard in this opened tab in IE11. (see screenshot below)
OPTION TWO
To Open Performance Dashboard in Desktop IE11
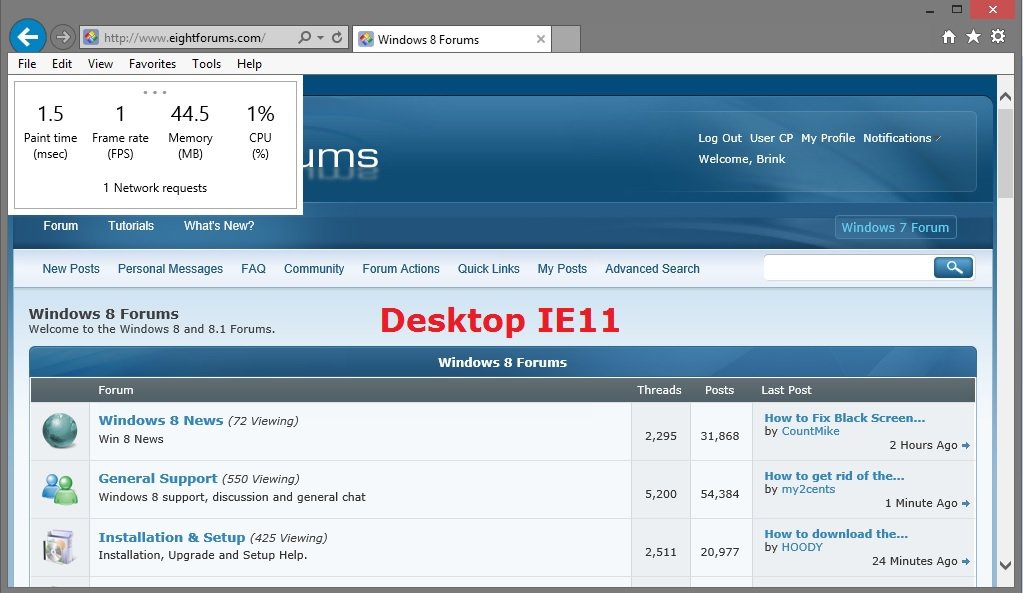
1. From your desktop, open the desktop IE11 (taskbar), and open a website in a tab that you wish to check the performance of.
2. Do either step 3 or 4 below for how you would like to toggle to open and close the Performance dashboard in this opened tab in IE11.
3. Press the CTRL+Shift+U keys, and go to step 5 below.
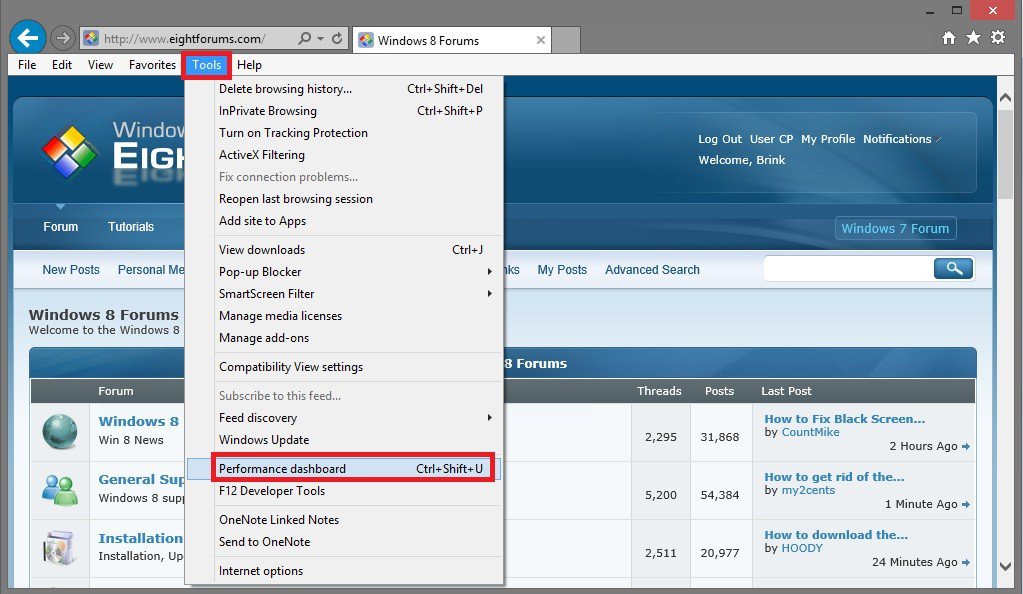
4. Click/tap on Tools (Alt+T) on the menu bar, click/tap on Performance dashboard, and go to step 5 below. (see screenshot below)
5. The Performance dashboard will now open or close. (see screenshot below)
That's it,
Shawn
Attachments
Last edited:


