
natostanco
New Member
- Messages
- 13
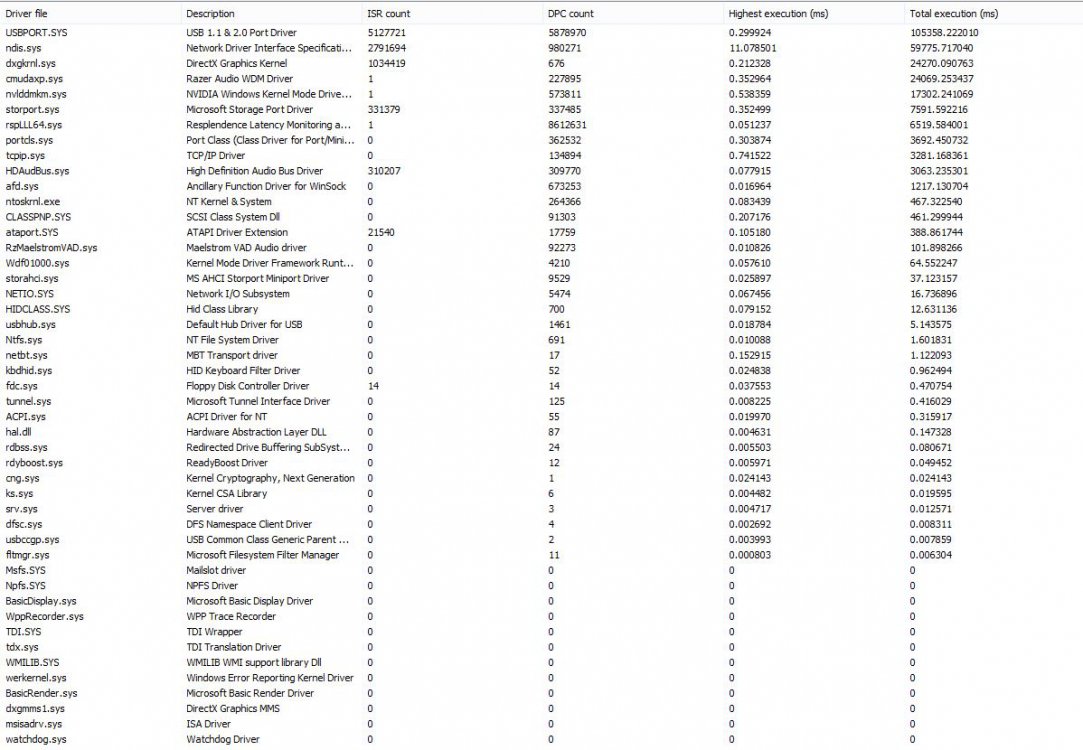
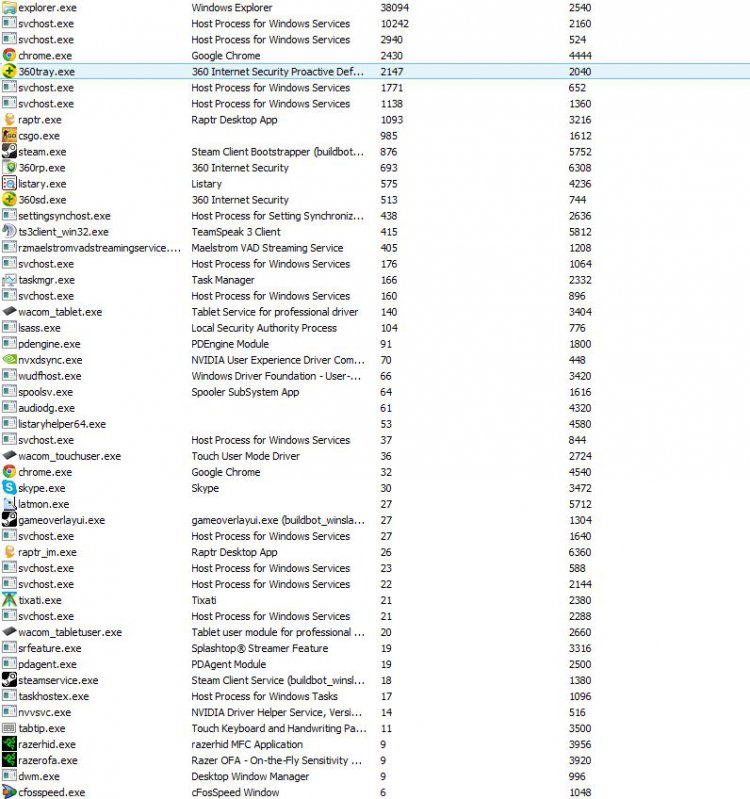
Can you take a look at these stats from latencymon and tell me if they are normal? I have included the main stats and screenshot of drivers and processes list after 1 hour of test, running different apps.
CONCLUSION_________________________________________________________________________________________________________
Your system appears to be having trouble handling real-time audio and other tasks. You are likely to experience buffer underruns appearing as drop outs, clicks or pops. One or more DPC routines that belong to a driver running in your system appear to be executing for too long. At least one detected problem appears to be network related. In case you are using a WLAN adapter, try disabling it to get better results. One problem may be related to power management, disable CPU throttling settings in Control Panel and BIOS setup. Check for BIOS updates.
LatencyMon has been analyzing your system for 1:00:32 (h:mm:ss) on all processors.
_________________________________________________________________________________________________________
SYSTEM INFORMATION
_________________________________________________________________________________________________________
Computer name: FRA
OS version: Windows 8 , 6.2, build: 9200 (x64)
Hardware: GA-MA790X-UD4, Gigabyte Technology Co., Ltd.
CPU: AuthenticAMD AMD Phenom(tm) II X3 720 Processor
Logical processors: 3
Processor groups: 1
RAM: 4093 MB total
_________________________________________________________________________________________________________
CPU SPEED
_________________________________________________________________________________________________________
Reported CPU speed: 3416.0 MHz
Measured CPU speed: 4263.0 MHz (approx.)
Note: reported execution times may be calculated based on a fixed reported CPU speed. Disable variable speed settings like Intel Speed Step and AMD Cool N Quiet in the BIOS setup for more accurate results.
_________________________________________________________________________________________________________
MEASURED INTERRUPT TO USER PROCESS LATENCIES
_________________________________________________________________________________________________________
The interrupt to process latency reflects the measured interval that a usermode process needed to respond to a hardware request from the moment the interrupt service routine started execution. This includes the scheduling and execution of a DPC routine, the signaling of an event and the waking up of a usermode thread from an idle wait state in response to that event.
Highest measured interrupt to process latency (µs): 9757.143221
Average measured interrupt to process latency (µs): 4.459461
Highest measured interrupt to DPC latency (µs): 2463.794838
Average measured interrupt to DPC latency (µs): 1.825950
_________________________________________________________________________________________________________
REPORTED ISRs
_________________________________________________________________________________________________________
Interrupt service routines are routines installed by the OS and device drivers that execute in response to a hardware interrupt signal.
Highest ISR routine execution time (µs): 212.328454
Driver with highest ISR routine execution time: dxgkrnl.sys - DirectX Graphics Kernel, Microsoft Corporation
Highest reported total ISR routine time (%): 0.466138
Driver with highest ISR total time: ndis.sys - Network Driver Interface Specification (NDIS), Microsoft Corporation
Total time spent in ISRs (%) 0.545933
ISR count (execution time <250 µs): 9617021
ISR count (execution time 250-500 µs): 0
ISR count (execution time 500-999 µs): 0
ISR count (execution time 1000-1999 µs): 0
ISR count (execution time 2000-3999 µs): 0
ISR count (execution time >=4000 µs): 0
_________________________________________________________________________________________________________
REPORTED DPCs
_________________________________________________________________________________________________________
DPC routines are part of the interrupt servicing dispatch mechanism and disable the possibility for a process to utilize the CPU while it is interrupted until the DPC has finished execution.
Highest DPC routine execution time (µs): 11078.500585
Driver with highest DPC routine execution time: ndis.sys - Network Driver Interface Specification (NDIS), Microsoft Corporation
Highest reported total DPC routine time (%): 0.523892
Driver with highest DPC total execution time: USBPORT.SYS - USB 1.1 & 2.0 Port Driver, Microsoft Corporation
Total time spent in DPCs (%) 1.819127
DPC count (execution time <250 µs): 18564593
DPC count (execution time 250-500 µs): 0
DPC count (execution time 500-999 µs): 15634
DPC count (execution time 1000-1999 µs): 135
DPC count (execution time 2000-3999 µs): 91
DPC count (execution time >=4000 µs): 0
_________________________________________________________________________________________________________
REPORTED HARD PAGEFAULTS
_________________________________________________________________________________________________________
Hard pagefaults are events that get triggered by making use of virtual memory that is not resident in RAM but backed by a memory mapped file on disk. The process of resolving the hard pagefault requires reading in the memory from disk while the process is interrupted and blocked from execution.
NOTE: some processes were hit by hard pagefaults. If these were programs producing audio, they are likely to interrupt the audio stream resulting in dropouts, clicks and pops. Check the Processes tab to see which programs were hit.
Process with highest pagefault count: explorer.exe
Total number of hard pagefaults 195030
Hard pagefault count of hardest hit process: 104767
Highest hard pagefault resolution time (µs): 5105052678276.250
Total time spent in hard pagefaults (%): 46860.369551
Number of processes hit: 60
_________________________________________________________________________________________________________
PER CPU DATA
_________________________________________________________________________________________________________
CPU 0 Interrupt cycle time (s): 115.755187
CPU 0 ISR highest execution time (µs): 181.387881
CPU 0 ISR total execution time (s): 1.442597
CPU 0 ISR count: 206683
CPU 0 DPC highest execution time (µs): 1715.539520
CPU 0 DPC total execution time (s): 41.631850
CPU 0 DPC count: 10542646
_________________________________________________________________________________________________________
CPU 1 Interrupt cycle time (s): 61.898710
CPU 1 ISR highest execution time (µs): 204.885246
CPU 1 ISR total execution time (s): 13.880212
CPU 1 ISR count: 2256049
CPU 1 DPC highest execution time (µs): 3824.185304
CPU 1 DPC total execution time (s): 15.113963
CPU 1 DPC count: 844909
_________________________________________________________________________________________________________
CPU 2 Interrupt cycle time (s): 219.914542
CPU 2 ISR highest execution time (µs): 212.328454
CPU 2 ISR total execution time (s): 44.163342
CPU 2 ISR count: 7154289
CPU 2 DPC highest execution time (µs): 11078.500585
CPU 2 DPC total execution time (s): 141.470492
CPU 2 DPC count: 7192919
_________________________________________________________________________________________________________
Attachments
My Computer
System One
-
- OS
- windows 8

